There’s a question that every serious broiler producer eventually starts asking — not “what do my birds weigh?” but “should my birds weigh this?”. That shift matters. The second question is the one that actually drives decisions.
There’s a question that every serious broiler producer eventually starts asking — not “what do my birds weigh?” but “should my birds weigh this?”. That shift matters. The second question is the one that actually drives decisions.
A chicken growth chart gives you the reference line. The growth curve — the shape of weekly weight progression from hatch to slaughter — tells you whether your flock is on track, running behind, or doing something biologically unusual that’s worth paying attention to. This article explains what a normal commercial broiler growth curve looks like, which deviations are minor, and which ones signal something you can’t ignore.
What the Normal Broiler Growth Curve Actually Looks Like
The standard broiler growth curve follows a predictable S-shape when plotted from day 1 to slaughter. Slow start. Steep middle. Then a gradual flattening as the bird approaches mature weight for its age class.
Three things define a healthy curve: the starting point (day-7 body weight), the slope of the grower phase (days 14–35), and the rate of deceleration in the finisher phase (days 36+). All three need to look right. A curve that’s steep early but flattens too fast usually points to a different problem than one that starts slow but catches up in weeks 4–5.
Weekly Weight and Daily Gain: Normal Reference Range (Ross 308, mixed sex)
Age / Live Weight / Avg Daily Gain / Cumulative Feed / Normal CV%
Day 7 / 175–185 g / ~19 g/day / 160 g / ≤8%
Day 14 / 455–475 g / ~40 g/day / 490 g / ≤9%
Day 21 / 880–920 g / ~62 g/day / 1,100 g / ≤10%
Day 28 / 1,490–1,550 g / ~88 g/day / 2,200 g / ≤11%
Day 35 / 2,150–2,250 g / ~96 g/day / 3,700 g / ≤11%
Day 42 / 2,820–2,980 g / ~100 g/day / 5,500 g / ≤12%
Day 49 / 3,480–3,620 g / ~93 g/day / 7,400 g / ≤12%
CV% (coefficient of variation) measures flock uniformity, not just average weight. A flock hitting the right average with a CV above 15% still has a management problem — a significant portion of the birds are well below target, and they’re dragging down your overall yield distribution.
The Three Phases of the Growth Curve — and What Can Go Wrong in Each
Phase 1: Starter (Days 1–10)
The most critical and most underestimated phase. Chicken growth rate in the first 10 days is slower in absolute terms but determines the entire trajectory of the grow-out. The gut is developing. Immune programming is happening. Thermo-regulation isn’t yet established.
A bird that’s 20 g below target at day 7 won’t “grow out of it” by week 4. Research consistently shows that day-7 body weight is one of the strongest single predictors of final slaughter weight in the flock. That 20-gram gap tends to widen, not close.
Warning signs in Phase 1:
- Day-7 average below 155 g (more than 15% under target)
- High CV% on day 7 (above 10%) — suggests uneven brooding temperature distribution
- Visible size sorting in the flock within the first week
Phase 2: Grower (Days 11–28)
This is where the chicken growth timeline becomes most visible. Daily gain climbs from around 40 g/day at day 14 to nearly 90 g/day by day 28. Skeletal development and breast muscle accretion are running at full pace simultaneously, which is why nutritional balance during this phase is so demanding.
A normal weekly chicken growth chart during this phase should show weight roughly doubling every 7–9 days. If you weigh at day 14 and day 21 and the flock hasn’t come close to doubling, you have a grower phase problem — not a finisher phase problem that can be “padded” later.
Warning signs in Phase 2:
- Average daily gain below 50 g/day at day 21 (target ~62 g)
- CV% rising above 12% mid-grower — usually points to feeder or drinker access issues
- Visual bunching around feeders — a spatial management problem, not a feed quality issue
Phase 3: Finisher (Days 29 to Slaughter)
Daily gain peaks around day 32–36 then begins a gradual, expected decline. This deceleration is normal — it reflects the biological cost of maintaining an increasingly large body mass. What’s not normal is a sudden plateau, a reversal, or a sharp drop in daily gain mid-finisher.
The finisher phase is also where FCR begins deteriorating fastest. Every day beyond peak daily gain costs you more feed per gram of gain. Understanding the chicken growth rate curve in this phase is essentially what determines optimal slaughter timing — which is a financial decision as much as a biological one.
Warning signs in Phase 3:
- Plateau or weight loss between two weekly measurements — disease, heat stress, or severe water restriction
- FCR climbing above 2.10 before day 42 — finisher feed spec likely off, or birds under chronic low-grade stress
- Average daily gain dropping below 70 g/day before day 38 — investigate health and environment before adjusting nutrition
Reading the Deviation: What the Shape of the Problem Tells You
Not all deviations from the chicken growth chart by week are equal. The pattern of the deviation — when it started, how steep it is, and whether it’s uniform across the flock or concentrated in a subpopulation — tells you most of what you need to know before you start investigating.
Deviation Pattern / Likely Cause Category / First Action
Below target from day 7, gap widens steadily / Starter failure: brooding temp, chick quality, early feed/water access / Review day-1 management protocols and chick placement records
On target weeks 1–2, then sudden drop week 3–4 / Grower phase issue: feed transition, respiratory disease, water line fault / Check feed delivery date, drinker pressure, respiratory signs
Acceptable average, but rising CV% (>13%) / Distribution problem: feeder/drinker placement, ventilation hot spots, litter issues / Map flock weight distribution spatially across the house
Normal growth weeks 1–4, plateau or reversal week 5+ / Disease event, heat stress, or feed contamination / Weigh daily, pull feed samples, check mortality trend
Below target entire grow-out, consistent shape / Genetic or nutritional baseline problem (starter spec, breed mismatch) / Compare against breeder performance data for that strain
Normal curve but 10–15% below target uniformly / Stocking density too high, or house capacity systematically exceeded / Calculate actual kg/m² at target slaughter weight
Tip: When you find a deviation, don’t just ask “what week did it start?” — ask “which part of the house did it start in?” Weigh birds from at least 5 different zones across the building and calculate zone-level averages separately. A whole-flock average can mask a severe localized problem that will only show up in your mortality numbers two weeks later.
Flock Uniformity: The Number Most Producers Ignore
Coefficient of variation (CV%) is calculated as: standard deviation ÷ average weight × 100. For a flock of 20,000 birds, you obviously can’t weigh everyone — but sampling 100–150 birds across multiple locations gives you a CV estimate that’s statistically meaningful.
A CV below 10% at day 21 is excellent. Between 10–12% is acceptable. Above 13% at any point in the grow-out is a signal that flock uniformity is breaking down — and that your average weight figure is masking significant within-flock variation.
Why does this matter beyond the average? Two reasons. First, high CV means a larger proportion of light birds that will miss your target slaughter specification. Second, high CV almost always points to a spatial or management problem, not a genetic or nutritional one — which means it’s fixable if you find it early enough.
Why Do Chickens Grow So Fast? The Science Behind the Curve
It’s a question that comes up constantly: why do chickens grow so fast? The answer is decades of selective breeding, not hormones. In most countries — including the US, EU, and UK — hormone use in poultry is banned outright.
Modern commercial broiler genetics have been selected for high feed intake, high feed efficiency, and disproportionately rapid breast muscle development. The result is a bird that adds roughly 60–100 g of body mass per day during peak growth — something that would have been impossible in the genetics of 30 or 40 years ago.
The biological tradeoff is real: the same genetics that produce that fast broiler chicken growth rate also create vulnerability to skeletal stress, ascites, and sudden death syndrome when management conditions aren’t tight. The growth curve is steep precisely because the bird’s physiology is operating close to its biological ceiling. That’s not a flaw — it’s the production model. But it means deviations from the curve matter more with modern strains than they did with slower-growing lines.
Causes of Stunted Growth in Chickens: A Diagnostic Framework
When your chicken growth chart by week shows a flock falling progressively behind, “stunted growth in chickens” is the symptom — not the diagnosis. Here’s how to work backwards from the weight data to the cause:
Nutritional Causes
- Starter feed crude protein below 21% — insufficient amino acid supply for the growth rate the genetics demand
- Energy density too low in grower phase — birds eat more but convert less efficiently
- Calcium:phosphorus imbalance in finisher — can inhibit growth and increase leg disorders simultaneously
- Mycotoxin contamination in grain — often missed because it produces a “slow fade” in growth rate rather than a sudden event
Environmental Causes
- Chronic cold stress in brooding — birds divert energy to thermoregulation instead of growth
- Inadequate ventilation causing CO₂ buildup above 3,000 ppm — measurably suppresses feed intake
- High stocking density above 38 kg/m² at target slaughter weight — reduces per-bird feed and water access under competitive pressure
- Litter quality problems (wet, caked litter) — increases pathogen load and foot pad dermatitis, both of which stress the bird and suppress gain
Disease and Health Causes
- Infectious bronchitis or Newcastle disease — both cause feed intake collapse and are visible in the growth curve within 3–5 days of onset
- Subclinical coccidiosis — often presents as rising CV% rather than elevated mortality, because some birds are affected more than others
- Enteric problems (necrotic enteritis, dysbacteriosis) — gut integrity issues reduce nutrient absorption efficiency without always triggering obvious clinical signs
How to Track the Growth Curve Properly
A weekly chicken growth chart is only useful if the data going in is consistent. Three common measurement mistakes that invalidate your data entirely:
- Weighing at different times of day. Morning weight (before first feeding) is consistently 3–5% lower than afternoon weight due to crop fill. Always weigh at the same time.
- Sampling from the same location each week. Birds near feeders or drinkers are systematically heavier. Rotate your sampling zones.
- Not calculating CV. If you record only the average, you lose the uniformity signal. Average and CV together tell the real story.
For accurate results, use a calibrated poultry platform scale and weigh at least 100 birds per house per measurement session. For houses over 30,000 birds, 150–200 is a more defensible sample size for identifying CV problems.
Interesting Fact: A broiler chick at hatch weighs roughly 42 g — about the same as a large egg yolk. By day 42, that same bird weighs close to 2.9 kg. That’s a 68-fold increase in body mass in six weeks. No other agricultural species comes close to that growth efficiency. For context, a pig achieves roughly a 3–4 fold increase over the same period under good conditions.
Frequently Asked Questions
What is a normal chicken growth rate per week?
For Ross 308 broilers under standard commercial conditions, average daily gain progresses from ~19 g/day in week 1 to a peak of ~100 g/day around days 36–40, then declines in the finisher phase. Expressed as weekly gain: roughly 130 g in week 1, 280 g in week 2, 435 g in week 3, 620 g in week 4, 680 g in week 5, and 700 g in week 6.
What causes stunted growth in chickens?
The most common causes of stunted growth in poultry fall into three categories: nutritional deficiencies (low protein, energy, or amino acid imbalance in starter or grower feed), environmental stress (cold, poor air quality, overcrowding), and health challenges (subclinical enteric or respiratory disease). The growth curve shape tells you when the problem started — the investigation tells you which category it falls into.
How do I know if my chicken growth is on track?
Compare your weekly flock average against a chicken growth chart for your specific strain. If your average falls within ±8% of the target weight and your CV% is below 12%, you’re on track. A deviation of more than 10% below target at any weekly measurement point, or a CV above 14%, warrants immediate investigation rather than waiting to see if the next week corrects it.
Why is my broiler growth slow in the first week?
First-week performance is almost always a brooding and placement quality issue. The most frequent causes: chicks didn’t reach the water in the first 2–3 hours after placement, brooding temperature was below 32°C, or the chick quality from the hatchery was poor (low yolk sac absorption). Check these three things before assuming a nutrition or disease problem.
The chicken growth curve doesn’t lie — but it only speaks to you if you’re measuring consistently and reading the shape, not just the average. Weekly weighing with proper sampling, combined with CV tracking, turns raw weight data into an early-warning system for almost every major production problem.
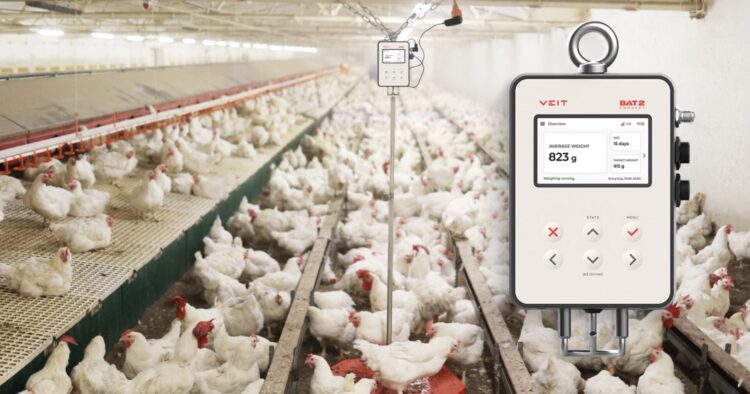
Accurate weight data starts with the right equipment. Explore professional poultry weighing scales for broiler and layer operations at poultryscales.com.